Data science uses data, statistics, programming, analytical methods, domain expertise, and increasingly artificial intelligence (AI) to answer business questions and support better decisions. Organizations use data science to identify patterns, test assumptions, forecast outcomes, optimize processes, and turn growing volumes of data into practical evidence for action.
However, its value does not come from analysis alone. Data science becomes a business capability when reliable data, appropriate methods, technology, governance, and people work together—and when the resulting insight changes a decision or process.
Data science turns enterprise data into evidence for decisions, predictions, and measurable business outcomes. Its value depends less on model sophistication than on four conditions: trustworthy data, clear governance, fit-for-purpose analytical methods, and integration into the workflow where action occurs.
A practical data science readiness check starts with five questions:
Gaps in these areas should be addressed before data science or AI is scaled.
Organizations generate data across applications, connected products, machines, customer interactions, transactions, documents, supply chains, and external ecosystems. At the same time, cloud platforms, scalable processing, and AI have expanded what can be analyzed and how quickly insights can be applied.
But more data does not automatically create more value. Useful data science starts with a clearly defined business problem, trustworthy and accessible data, the right analytical approach, and an operational path for acting on the result. As AI becomes more deeply embedded in business processes, the quality, accessibility, and reliability of enterprise data become critical. T-Systems likewise positions connected, high-quality, and reliable data as a foundation for scalable AI and data transformation.
Business and transformation leaders: start with business value, use-case selection, industry examples, and the implementation pathway. CIOs and technology leaders: focus on architecture, data infrastructure, integration, security, and operations. CDOs and data leaders: focus on readiness, data quality, governance, lifecycle, trustworthiness, and scaling. Data and AI teams: use the lifecycle, method-selection guide, tools, team model, and AI/GenAI sections as a practical reference. Marketers and communications teams: use the definition, business-value, comparison, application, and practical-example sections to build accurate messaging without needing the implementation detail. Students and early-stage practitioners: start with foundations, scope, lifecycle, techniques, tools, and the FAQ; move into infrastructure, MLOps, and enterprise implementation after those basics are clear.
Data science rests on five connected foundations: relevant and representative data; statistical reasoning; programming and computing; domain expertise; and governance. In enterprise settings, data engineering and platform capabilities turn these foundations into repeatable workflows by making data accessible, traceable, secure, and reusable. A weakness in any one foundation can limit the reliability or operational value of the result.
The term data science combines data with the scientific practice of forming questions, testing evidence, and drawing reproducible conclusions. In modern enterprise usage, it describes an interdisciplinary field that extends beyond analysis to include data preparation, statistical methods, computing, machine learning, communication, governance, and operational integration.
The scope of data science spans the full path from problem framing to measurement: acquiring and governing data, exploring patterns, engineering features, selecting methods, training and validating models, communicating uncertainty, integrating outputs into applications or workflows, and monitoring outcomes. It can support descriptive, diagnostic, predictive, and prescriptive questions, with or without machine learning.
Data science is an interdisciplinary approach to extracting useful knowledge, evidence, predictions, and recommendations from data. It brings together statistical reasoning, programming, data management, analytical modeling, visualization, and business or domain expertise.
Depending on the problem, a data science project may involve descriptive analysis, statistical testing, forecasting, optimization, machine learning, natural language processing, computer vision, or combinations of these techniques. Machine learning is therefore an important tool within data science, but data science is broader than machine learning.
A data science project usually attempts to answer one or more practical questions: What has happened? Why might it have happened? What is likely to happen next? Which factors influence the outcome? Which cases require attention? What action could improve the result? How confident are we in the conclusion?
For example, a manufacturer may combine sensor, maintenance, production, and quality data to understand why defects occur and estimate when equipment may require servicing. A retailer may analyze transaction and behavioral data to improve demand forecasts or customer recommendations. The analytical technique should be selected according to the question, not the other way around.
The goal of data science is to turn data into reliable evidence that improves a decision, action, or measurable outcome. Depending on the business problem, that may mean explaining what happened, predicting what is likely to happen, identifying cases that need attention, recommending an action, or quantifying the effect of a change.
Data science has developed through the convergence of statistics, scientific computing, databases, data mining, and software engineering. As organizations adopted larger data platforms, cloud computing, and machine learning, the discipline expanded from one-off analysis towards production analytics and model-driven applications. The current phase adds generative AI (GenAI), retrieval-augmented generation, and increasingly automated workflows, which increases the importance of trusted data, evaluation, governance, integration, and continuous monitoring.
No. Data science can create value from datasets of many sizes. The relevant question is whether the data adequately represents the problem and supports a reliable analysis.
Large, complex, fast-moving, or highly diverse datasets may require distributed processing and big-data architectures. But a smaller, well-governed dataset can be more useful than a much larger dataset containing inconsistent definitions, missing observations, or irrelevant information.
A useful way to understand data science is as a progression from data to context, analysis, evidence, decision, action, and outcome. The final stages matter the most. An accurate forecast has little value if it arrives after a planning decision has already been made. An anomaly score creates limited value if no workflow determines who should investigate it. Data science becomes useful when its output is trusted, timely, and connected to a business action.
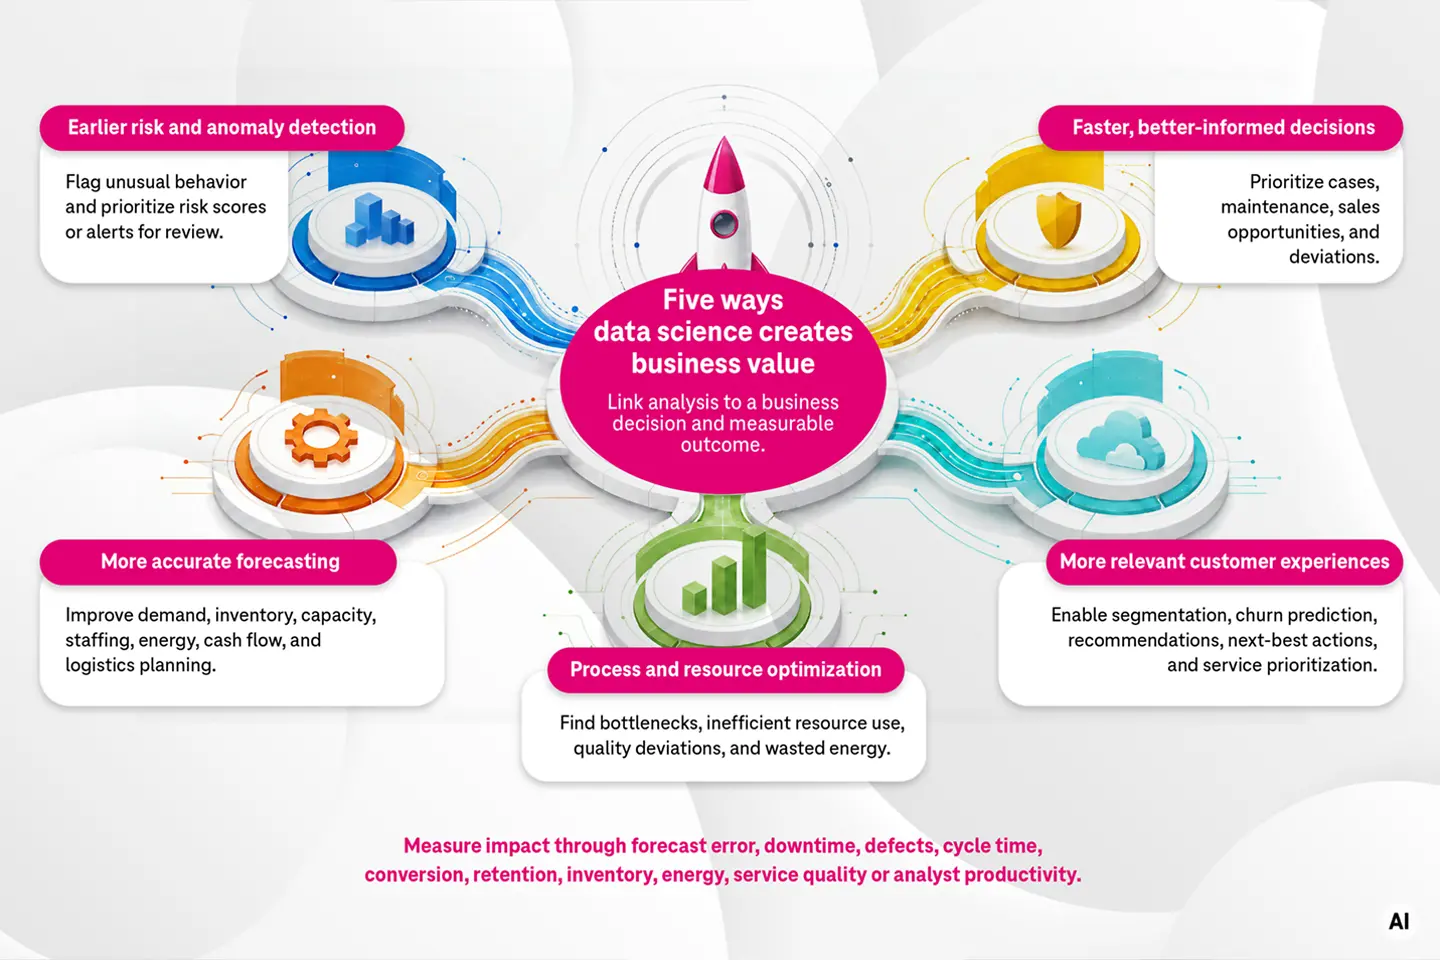
Data science can improve decisions across an organization, but its impact depends on the frequency and importance of the decision, the quality of available evidence, the cost of error, and whether users can act on the outcome.
Common goals of data science include improving decision quality and speed, forecasting future demand or risk, detecting anomalies earlier, optimizing resources and processes, personalizing experiences, and creating reusable analytical capabilities. The goal should be expressed in business terms and linked to an outcome metric rather than defined only by model accuracy.
Data science can combine many variables into consistent analyses that help teams prioritize cases or understand complex situations. Examples include identifying high-risk transactions, prioritizing maintenance work, ranking sales opportunities, or identifying operational deviations. The objective is not always automation. In high-impact situations, the output may instead provide evidence that helps a specialist make the final decision.
Forecasting can support decisions about demand, inventory, capacity, staffing, energy consumption, cash flow, and logistics. Data scientists may combine historical patterns with drivers such as seasonality, pricing, promotions, weather, economic indicators, or operational constraints. A useful forecast should be evaluated against an understandable baseline and against the business cost of forecast error.
Data science can identify unusual behavior across transactions, equipment, networks, processes, and customer interactions. The result is often a risk score or a prioritized alert rather than a binary answer. Effective solutions balance the cost of missed events against the effort created by false alarms.
Data can reveal bottlenecks, inefficient resource allocation, quality deviations, unnecessary energy consumption, and process variability. Optimization techniques can then help organizations evaluate alternative decisions or operating configurations.
Customer analytics can support segmentation, churn prediction, recommendations, next-best actions, and service prioritization. These methods should be used within clear privacy boundaries, and organizations should avoid inappropriate or discriminatory inferences.
Data science projects should begin with a measurable outcome. Relevant metrics may include forecast error, downtime, defect rate, process cycle time, conversion, retention, cost per transaction, inventory levels, energy consumption, service quality, or analyst productivity. A sophisticated model is not automatically more valuable than a simple analysis. The best solution is the one that improves the target decision reliably and economically.
Data science is iterative rather than strictly linear. New findings can reveal that additional data is required, that the original hypothesis was incorrect, or that the business question needs to be reformulated. A practical enterprise lifecycle connects analytical work directly to implementation and measurement.
Start with the business decision or process, not with an algorithm. Clarify what decision needs to improve, who makes that decision, what evidence is currently used, what a useful analytical output would look like, what the cost of error is, and how business value will be measured. The output might be an explanation, forecast, probability, classification, recommendation, anomaly score, scenario, or optimization.
Identify the information required to represent the problem. Sources may include business applications, transaction systems, sensors and machines, logs, images, video, documents, customer interactions, external datasets, and partner ecosystems. Data ownership, permission, lineage, quality, retention, and access requirements should be clarified before extensive modeling begins.
Exploratory analysis first examines distributions, relationships, missing values, outliers, bias, unusual patterns, and possible data leakage; its output is an evidence-based view of what the data can and cannot support. Data preparation then joins sources, corrects inconsistent formats, handles missing values, and labels examples. Feature engineering creates the analytical variables a model will use, such as time-window indicators, ratios, lags, aggregates, or representations derived from unstructured information. This stage frequently determines whether later results will be meaningful.
The appropriate analytical method depends on the problem. A team may begin with a statistical or rules-based baseline before comparing more complex alternatives. Model training then fits candidate methods to the prepared features, producing a reproducible model or analytical rule set that can be evaluated on representative data not used for fitting. Models should be selected not only for accuracy, but also for interpretability, latency, robustness, cost, maintainability, and the environment in which the result will be used.
Results must be tested on representative data that was not simply memorized during development. Validation should ask whether the analysis generalizes, whether performance differs across important segments, whether results are stable over time, what happens when the method is wrong, and whether business users can understand and use the output. In agile delivery, validation is a feedback loop rather than a one-way gate: if it reveals weak coverage, leakage, unstable features, or performance gaps, teams return to data preparation, the data foundation, or model selection, make adjustments, and validate again.
A data science output must reach the person or system that can act on it. This may involve dashboards, reports, APIs, alerts, planning applications, automated workflows, enterprise software, or embedded recommendations. Communication is a part of the analytical task. Decision-makers need to understand both the result and its uncertainty, assumptions, and implications.
Conditions change. Customer behavior, equipment, products, policies, market conditions, and source systems can all alter the usefulness of an analysis. Teams should monitor both technical performance and business outcomes, then refine, retrain, recalibrate, or retire analytical components when necessary. The predictive-maintenance example below illustrates this lifecycle:
Data science cannot compensate indefinitely for weak data management. Many analytical problems that initially look like modeling challenges are actually data-access, data-quality, or definition problems.
Data should be evaluated for accuracy, completeness, consistency, timeliness, relevance, representativeness, and traceability. A more complex algorithm trained on unreliable information can simply reproduce the underlying weaknesses more efficiently.
A field called customer, revenue, active user, or failure may mean different things in different systems or departments. Data science therefore depends on shared definitions and domain knowledge. Semantic models, metadata, and documented business logic can reduce ambiguity and prevent teams from repeatedly reinterpreting the same data.
Instead of preparing the same information separately for every analytical project, organizations can develop governed data products designed for repeated use. A reusable data product typically has a defined owner, documented meaning, quality expectations, access rules, interfaces, lineage, and lifecycle management. This can reduce duplicated preparation work and make trusted data easier to use across analytics and AI.
The terminology surrounding data-driven work can be confusing because the disciplines overlap. They are better understood as complementary capabilities than as rigidly separated categories.
Data analytics is the broader practice of examining data to answer questions and support decisions. Data analysis is the narrower activity within analytics: inspecting, transforming, comparing, and interpreting data for a defined question. Data science includes both but often extends further into statistical modeling, experimentation, programming, machine learning, optimization, and development of reusable analytical methods. In practice, the boundary varies between organizations.
Business intelligence typically helps organizations monitor and understand business performance using reports, dashboards, metrics, and structured data. Data science often works with less predefined questions and can include predictive or experimental methods. Business intelligence might show that product returns increased last month. Data science could investigate which factors are associated with returns and estimate the probability that a future order will be returned. Both can work together.
Statistics provide foundational methods for understanding variation, uncertainty, relationships, and inference. Data science uses statistical methods, but combines them with programming, data engineering, computing, domain expertise, and operational integration.
Data engineering focuses on building reliable systems and pipelines that collect, transform, store, and deliver data. Data science uses that data to answer questions and build analytical solutions. At enterprise scale, the two disciplines depend heavily on each other.
Machine learning trains models to learn relationships from data and apply them to new observations. Data science may use machine learning, but it also includes data exploration, statistics, experimentation, visualization, business interpretation, and analytical communication. Not every data science project requires machine learning. Learn more in the T-Systems guide What is machine learning?
AI is the broader field concerned with systems that perform tasks associated with intelligent behavior. Data science provides many of the data, evaluation, and modeling practices used to build and assess AI applications. A modern enterprise AI system may therefore involve data engineering, data science, machine learning, software engineering, governance, and domain expertise simultaneously.
Business intelligence: Use it for "What happened?" and "Are KPIs on target?" through governed metrics, dashboards, and recurring reporting
Analytics: Use it for "Why did it happen?" and "Where are patterns or segments?" through exploratory and diagnostic analyses
Data science: Use it for "What is likely to happen?" or "What action is best?" through prediction, experimentation, optimization, and uncertainty estimation
AI: Use it when a system must interpret or generate content, interact with users, perceive complex inputs, or automate tasks using ML or GenAI capabilities
The categories overlap: one workflow may use BI for monitoring, analytics for diagnosis, data science for prediction, and AI for automated interaction.
The right method depends on the question and the available evidence. Data science should use the simplest method that provides sufficient evidence for the decision. Common algorithm categories that business leaders may encounter include regression, classification, clustering, decision trees and ensemble methods, and anomaly detection.
Match the method to the business question and the consequence of error: use descriptive or exploratory analysis for “what happened and where?”, statistical inference or experiments for “did this change cause an effect?”, forecasting or predictive models for “what is likely to happen?”, classification or anomaly detection for “which cases need attention?”, optimization for “what action is best under constraints?”, and NLP or computer vision when the evidence is mainly text, images, audio, or video. Key trade-offs include accuracy versus interpretability, false positives versus missed events, causal confidence versus experimental feasibility, latency versus complexity, and performance versus operating cost.
Evaluation should match the task and the cost of error. For classification or alerting, precision and recall show the trade-off between false alarms and missed events, with F1 or precision-recall AUC useful when classes are imbalanced. Forecasting commonly uses MAE, RMSE, MAPE, or sMAPE, supplemented by planning outcomes such as stockouts or service level. Regression can use MAE or RMSE; ranking and recommendations can use precision@k, recall@k, or NDCG plus conversion or adoption; optimization should track objective improvement and constraint violations; and GenAI or RAG evaluation should combine retrieval relevance, groundedness or factuality, task success, latency, and cost. Technical measures should always be interpreted alongside the business outcome metric.
Descriptive analysis summarizes patterns already present in the data. Exploratory analysis investigates distributions, relationships, unusual observations, and potential explanations without assuming that the first hypothesis is correct.
Statistical inference helps teams distinguish meaningful relationships from random variation. Controlled experiments such as A/B tests can compare alternatives where experimental design is practical. Where experiments are impossible, observational methods can support analysis, but causal conclusions require stronger assumptions than simple correlation.
Predictive methods estimate outcomes for new cases. Examples include churn probability, equipment failure risk, transaction risk, delivery time, demand, and product quality. Predictions should be evaluated against the business consequence of error, not only a technical accuracy score.
Time-series methods analyze ordered observations and can account for patterns such as trends, seasonality, and changing conditions. They are commonly used for demand, capacity, energy, financial, and operational planning.
Optimization evaluates possible actions under objectives and constraints. Examples include routing, scheduling, resource allocation, inventory planning, and production decisions.
Text, images, documents, audio, and video contain valuable information, but often require specialized methods. Natural language processing can support classification, information extraction, search, and sentiment analysis, while computer vision can support image classification, object detection, and quality inspection.
Visualization helps specialists and decision-makers understand patterns, uncertainty, and trade-offs. Effective communication is not a cosmetic final step: it determines whether analytical evidence can influence a decision.
Data science teams typically use a combination of tools rather than a single standard stack. A practical toolchain covers data preparation and querying, development, visualization, modeling, version control, orchestration, deployment, and monitoring. Tool choice should reflect the use case, data landscape, security requirements, and operating model—not popularity alone.
Python, R, and SQL are among the most common languages used in data science. Python is widely used because of its broad ecosystem for data manipulation, statistics, machine learning, and visualization.
Notebook environments support exploration, documentation, visualization, and experimentation. Production systems require stronger controls around versioning, testing, and reproducibility than exploratory notebooks alone can provide.
Visualization and BI tools help analytical results reach operational and business users. Dashboards are particularly useful when results must be monitored repeatedly rather than delivered as a one-time analysis.
Common frameworks and libraries include scikit-learn, XGBoost, TensorFlow, PyTorch, and Spark-based libraries. The framework should follow the use case rather than dictate it.
Enterprise teams also need source control, experiment tracking, pipeline orchestration, data-quality testing, model registries, deployment, monitoring, and documentation. The objective is reproducibility and controlled change.
Data science infrastructure should reflect the data volume, sensitivity, location, latency, processing requirements, and expected business use. There is no single architecture for every organization.
A data warehouse provides structured, governed data optimized for analysis and reporting. A data lake can store larger varieties of raw and processed data. Lakehouse architectures combine characteristics of both approaches by supporting diverse data with stronger management and analytical capabilities.
Data science and cloud computing are closely linked because analytical workloads often need scalable storage and compute, managed data services, collaborative development environments, and access to AI and machine-learning tooling. Cloud platforms can shorten experimentation cycles and make capacity easier to scale, while architecture choices still need to reflect data location, latency, integration, security, sovereignty, and regulatory requirements.
Cloud computing for data science can support data ingestion and transformation, distributed processing, notebooks, model training, feature and model management, APIs, monitoring, and collaborative development. Public cloud is not the only option: private, sovereign, and hybrid designs can be appropriate when workloads require stronger controls over location, isolation, connectivity, or compliance. The right model balances scalability, cost, governance, and operational fit.
Cloud platforms can provide scalable storage and computing resources for data-intensive work. Private or hybrid architectures may be appropriate where data location, latency, integration, sovereignty, security, or regulatory requirements make a single public-cloud approach unsuitable.
A data mesh approach distributes responsibility for data towards the business domains that understand it while maintaining common standards and governance. T-Systems describes its data mesh approach around domain-oriented ownership, data products, federated governance, and self-service platforms.
Many data science opportunities require information beyond one organization. Data spaces can support controlled data exchange between participants under agreed rules governing use, enabling cross-company analytics in ecosystems such as manufacturing, mobility, and supply chains.
Some data is generated where rapid decisions are required, for example in factories, vehicles, utilities, or remote infrastructure. Processing part of the data closer to its source can reduce latency or unnecessary data transfer, while central platforms support broader analytics and governance. T-Systems' Big Data Analytics and Global Edge Analytics, and Machine Data Analytics offerings illustrate approaches for distributed and machine-generated data.
Enterprise data science is a team capability rather than a single job description.
Data science is technology-intensive, but it is not simply an IT job or an IT-department function. IT typically provides or supports platforms, infrastructure, integration, security, and operations, while data science is a cross-functional business capability that combines technical specialists with domain experts and decision-makers. Depending on the organization, data scientists may sit in IT, a central data or AI function, or individual business units, but their work should remain connected to measurable business outcomes.
In smaller organizations, data scientists often sit in a central technology, analytics, or product team and may cover analysis, data preparation, engineering, and deployment more broadly. Large enterprises more often distribute responsibilities across central data or AI functions, business-unit teams, data engineering, platform operations, and governance. The important design choice is clear accountability and shared standards rather than one fixed reporting line.
Data scientists combine analytical methods, statistics, programming, and domain understanding to explore data, test hypotheses, and build analytical models. They translate business questions into testable analytical problems; explore and prepare data; engineer features; select, train, and validate methods; explain uncertainty and error trade-offs; and work with engineering, domain, and operational teams to integrate outputs, monitor performance, and measure business outcomes.
A data scientist typically works iteratively. They clarify the decision and success metric with the business, assess whether available data can represent the problem, explore and prepare the data, engineer features where useful, establish a baseline, train or fit candidate methods, and validate them on representative data. They then communicate uncertainty and trade-offs, work with engineering and operational teams to integrate the output, and monitor both technical performance and the business outcome after deployment.
Data engineers design and operate the pipelines and platforms that make reliable data available.
Analysts translate business questions into data analysis and communicate findings. Analytics engineers often create reusable, tested transformations and semantic data layers between raw data platforms and business consumption.
Machine-learning engineers specialize in deploying, scaling, and maintaining machine-learning components in production systems.
Domain specialists understand the business process and determine whether a technically valid result makes sense operationally. Product owners connect analytical work to users, priorities, and measurable outcomes.
These specialists help ensure that data and analytical systems are used within the appropriate privacy, security, regulatory, and organizational boundaries.
Use clear ownership across the lifecycle: business owners are accountable for outcomes; domain experts define process context and acceptable actions; data engineers provide governed data; data scientists own analytical design and evaluation; ML/software engineers productionize models and services; IT/platform teams manage infrastructure, integration, security, and observability; governance, legal, and risk specialists set controls; and operational users act on outputs and provide feedback. A product owner or use-case lead coordinates priorities, adoption, and lifecycle decisions.
Not every analytics use case requires data science or machine learning. BI and analytics are usually sufficient for KPI monitoring, standard reporting, descriptive dashboards, deterministic calculations, and recurring variance analysis. Data science or ML is more relevant for prediction, uncertainty estimation, pattern discovery, experimentation, optimization, anomaly detection, or complex and unstructured data. Data science is applied wherever organizations make repeated or high-impact decisions, have measurable outcomes, and have data representing the underlying process. Common areas include:
Applications include predictive maintenance, visual quality analysis, production optimization, engineering analytics, test-data analysis, supply-chain planning, and energy management. Industrial data often requires contextual knowledge of equipment, production conditions, and operational constraints.
Data science supports fraud detection, claims analysis, risk assessment, forecasting, customer analytics, and process prioritization. Models that materially affect individuals require particularly strong governance, transparency, and review.
Applications include medical-image analysis, operational forecasting, research analytics, patient-flow planning, pharmacovigilance, and resource planning. Sensitive health data requires appropriate privacy, access, and regulatory controls.
Data science can support planning, forecasting, document analysis, infrastructure management, service optimization, anomaly detection, and policy evaluation. Public-sector applications also require attention to transparency, accessibility, auditability, and fundamental rights.
Use cases include demand forecasting, inventory optimization, recommendations, route planning, delivery-time estimation, customer analytics, and warehouse optimization.
Data science can support load forecasting, asset analytics, grid planning, predictive maintenance, energy optimization, and demand analysis. Critical infrastructure adds resilience, cybersecurity, and operational-safety requirements.
In practice, data science is used inside operational workflows rather than as a standalone analysis. Typical outputs include demand forecasts used in planning, failure-risk scores routed to maintenance, fraud alerts prioritized for investigators, recommendations presented in digital channels, quality predictions embedded in production, and optimization results used for routes, capacity, staffing, or energy decisions.
Data science is most needed when a decision cannot be handled reliably with fixed rules or descriptive reporting alone—for example, when teams must predict uncertain outcomes, detect subtle patterns, compare many variables, learn from unstructured data, optimize under constraints, or evaluate interventions. Standard BI or data analysis is often sufficient when the question is primarily what happened, how a KPI changed, or whether a known threshold was crossed.
Data science combines historical demand with relevant drivers to support inventory, staffing, production, energy, and capacity decisions.
Sensor and maintenance data can help estimate equipment condition, failure risk, or remaining useful life so that maintenance can be planned more effectively.
Statistical and machine-learning methods can identify events that deviate from expected behavior and prioritize them for review.
Behavioral, transactional, and contextual data can support segmentation, churn analysis, recommendations, and next-best actions.
Data from production, testing, and inspection can reveal conditions associated with defects and support continuous process improvement.
Data science methods can classify documents, extract information, identify patterns, and connect unstructured content with business processes.
Forecasting and optimization can support decisions about routes, capacity, staffing, networks, energy, or infrastructure.
Inputs: Historical sales, prices and promotions, stock levels, seasonality, holidays, weather, and store or product attributes
User decision: A demand planner decides how much inventory to reorder, transfer, or allocate for each store and product
Workflow action: Forecasts and confidence ranges feed the replenishment workflow; material exceptions are routed to planners for review before orders are released
Measured result: Track forecast error and stockout rate alongside inventory turns or holding cost; success means fewer stockouts and better forecast accuracy without creating excess inventory
Trustworthy data science requires more than an accurate model. It requires a clear purpose, accountable ownership, appropriate data use, robust validation, transparency, and ongoing oversight.
Ethics in data science starts with the purpose and impact of analysis. Teams should assess whether data use is lawful and appropriate, whether relevant groups and conditions are represented, whether errors could cause unfair or unsafe outcomes, whether explanations are proportionate, and whether human review or override is needed. Accountability should span data, methodology, deployment, and monitoring. In enterprise practice, ethical safeguards intersect with privacy, security, compliance, and responsible AI governance. Teams should also consider whether a feasible use case should be pursued and how its benefits and risks affect stakeholders.
Teams should understand where data comes from, what it measures, which populations or conditions it represents, and where important gaps exist.
When personal data is involved, organizations operating under the General Data Protection Regulation (GDPR) need to consider principles including lawfulness, fairness and transparency, purpose limitation, data minimization, storage limitation, accuracy, integrity and confidentiality, and accountability.1
The level of explanation required depends on how the result will be used. A low-impact internal forecast has different transparency requirements from a model that influences access to employment, healthcare, or financial services.
Data science environments can contain sensitive datasets, credentials, notebooks, APIs, models, and pipelines. Access controls, encryption, software-security practices, audit logging, and incident response should reflect the sensitivity of the workload.
Organizations should identify data ownership, analytical methodology, business use, approval, operational performance, risk, and retirement of a data science solution. For AI-enabled systems, the NIST AI Risk Management Framework provides a structured approach for considering trustworthiness and risk across the design, development, deployment, and use of AI systems.2 In the European Union, obligations under the AI Act depend on factors including the organization's role and the classification and use of the AI system.3
The above sections explain what data science is, where it creates value, and how to choose among BI, analytics, data science, and AI. The implementation section below is a deeper dive for readers assessing readiness or planning delivery; awareness-stage readers can skip ahead to AI and GenAI, practical examples, or the FAQ without losing the core explanation.
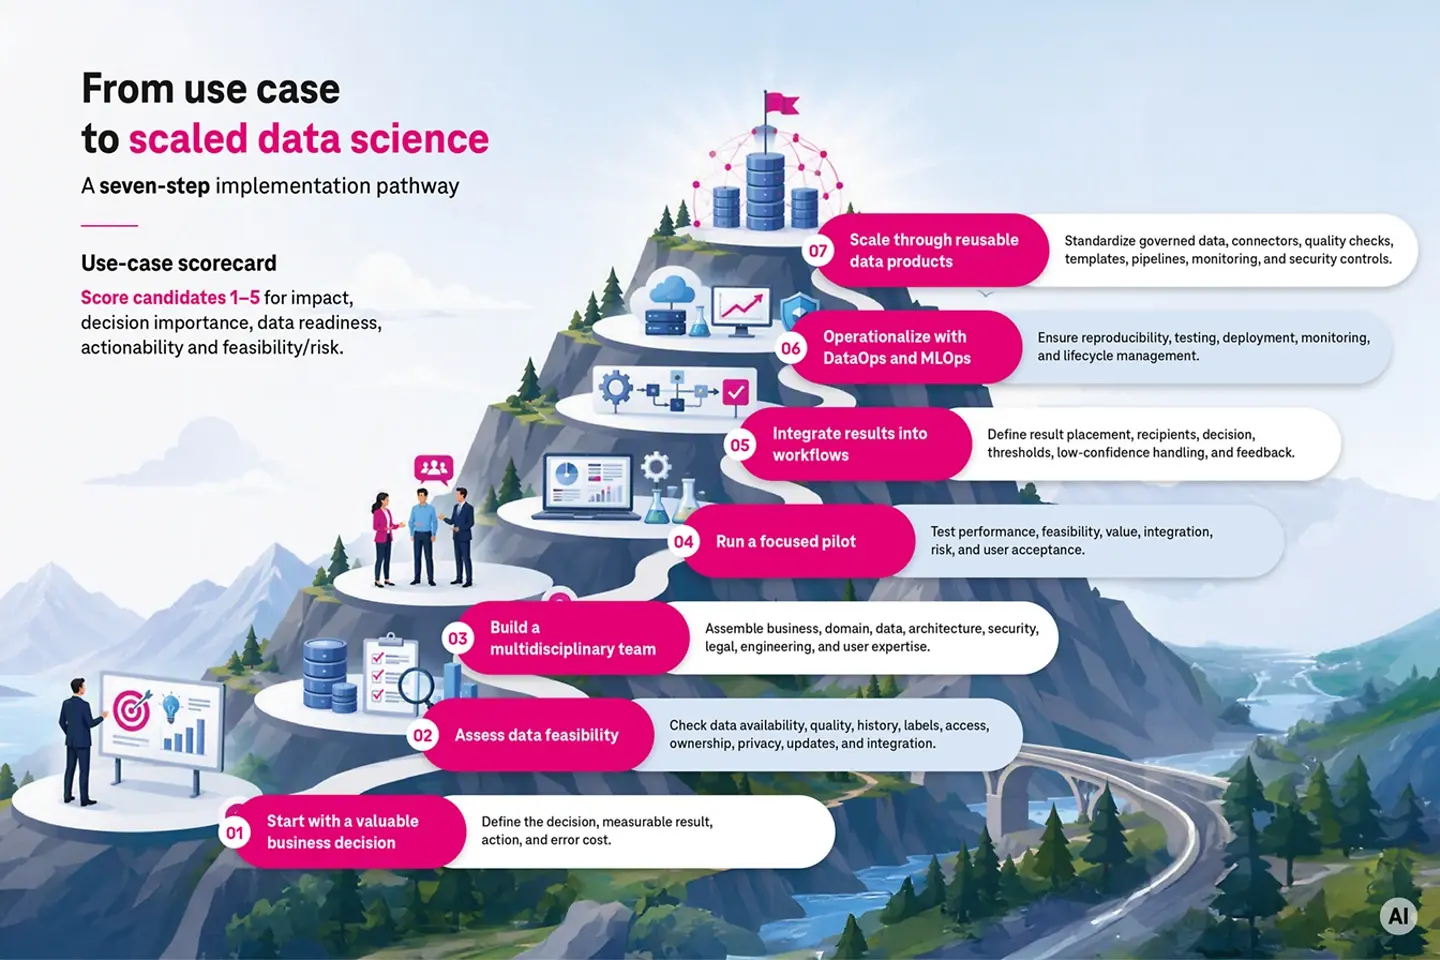
A successful data science program starts with business value and develops the technical and organizational capability needed to repeat that value across multiple use cases.
Score each candidate use case from 1 to 5 on five factors: business impact, decision frequency or importance, data readiness, workflow actionability, and delivery feasibility/risk. Prioritize use cases that combine high business impact with high data and workflow readiness. A strong candidate has a named decision owner, a measurable outcome, sufficient governed data, a clear action triggered by the output, and an acceptable cost of error. Deprioritize ideas that depend mainly on model novelty but lack a reachable business decision or operational pathway. Before selecting a pilot, assess readiness across the decision, data, governance, ownership, workflow integration, and measurement. This keeps data science implementation focused on use cases that can move from analysis to operational value.
Choose a problem where improved evidence can change an action. Ask whether the decision is frequent or important enough, whether the result can be measured, whether relevant data is available, whether users can act on the output, and what happens if the analysis is wrong.
Evaluate availability, quality, history, labels, access, ownership, privacy, update frequency, and integration effort. A feasibility assessment can prevent investment in sophisticated modeling before the data problem has been solved.
Bring together business owners, domain experts, data engineering, data science, architecture, security, legal and compliance, software engineering, and operational users. This reduces the risk of creating technically successful work that cannot be adopted.
A pilot should answer defined questions about analytical performance, data feasibility, business value, integration, risk, and user acceptance. The objective is evidence, not merely a demonstration.
Determine where the result appears, who receives it, what decision follows, what threshold triggers action, what happens when confidence is low, and how users provide feedback.
DataOps applies engineering and operational practices to reliable data pipelines and data delivery. MLOps addresses reproducibility, testing, deployment, monitoring, and lifecycle management for machine-learning models. Not every data science project requires MLOps, but recurring analytical products need controlled operation and clear ownership.
Once successful patterns emerge, standardize governed datasets, data products, connectors, quality checks, analytical templates, deployment pipelines, monitoring, and security controls. Scaling should reduce the effort required to move from the second use case to the tenth.
Low-quality, fragmented, undocumented, or inaccessible data can undermine analysis before modeling begins. Organizations need clear ownership and practical mechanisms for correcting data issues rather than relying on analysts to work around them, project by project.
Historical data can reflect gaps, unequal treatment, or business processes that have changed. Teams should evaluate performance across relevant groups, locations, time periods, and operating conditions instead of relying on a single average metric.
An observed relationship does not necessarily mean that one factor causes another. Causal claims require appropriate experimental or quasi-experimental designs and transparent assumptions.
Data science depends on collaboration between technical and business roles. Weak handovers between data engineering, data analysis, software development, security, and operations can create delays or solutions that are difficult to sustain.
A successful proof of concept is not yet a production capability. Scaling requires repeatable data access, integration, monitoring, support processes, governance, and a portfolio view that prevents duplicated or unmanaged analytical solutions.
AI will automate and change parts of data science work, but it will not replace data science. The role of data science is expanding as organizations combine predictive analytics, generative models, unstructured data, and enterprise knowledge. Continuing responsibilities include creating trusted data, evaluating model and retrieval quality, detecting systematic errors, governing use, integrating outputs into workflows, and measuring business outcomes.
GenAI does not eliminate the need for data management. It increases the importance of reliable, accessible, governed, and context-rich enterprise information. T-Systems' Artificial Intelligence and Data proposition likewise emphasizes data quality, accessibility, and reliability as foundations for AI adoption.
Data science supports GenAI by helping teams analyze available enterprise information, evaluate training or retrieval data, measure output quality, detect systemic errors, compare model configurations, monitor user behavior, and quantify business impact.
Retrieval-augmented generation, or RAG, connects a generative model with selected external information at the time a response is created. Data science and data engineering help determine what information should be indexed, how it should be structured, how relevance should be measured, and how retrieval quality should be evaluated.
Generative systems require evaluation across dimensions such as factual accuracy, relevance, completeness, consistency, latency, cost, safety, user acceptance, and realized business outcomes. The right evaluation set should reflect the intended users, content, and operating conditions.
The future of enterprise data science is not simply about building more models. It is about combining trusted data, analytics, predictive models, GenAI, applications, governance, and human expertise into repeatable business capabilities.
T-Systems' Data Intelligence portfolio combines data-management and analytics capabilities for enterprise transformation. Relevant offerings include Big Data Analytics, Data Intelligence Hub, Data Spaces, Data Mesh, and Machine Data Analytics. Its broader Artificial Intelligence and Data Analytics capabilities connect data assessment, analytics, AI development, application integration, and operation.
The appropriate combination depends on the business problem, data landscape, regulatory context, operating model, data sensitivity, latency requirements, and required level of integration. The objective should be to move from isolated analytical work towards repeatable data and AI capabilities that can be governed and operated over time.
Practical examples of data science include predictive maintenance for industrial assets, demand forecasting, anomaly and fraud detection, customer churn prediction, route and network optimization, visual quality inspection, document classification, and retrieval evaluation for GenAI. The strongest examples connect an analytical output to a named user, an operational workflow, and a measurable outcome. The T-Systems examples below span data science, advanced analytics, data-space analytics, and AI. They illustrate the broader path from governed data to decisions and measurable results; not every case requires machine learning.
ASTA Brazil needed a more flexible way to integrate new data sources and adapt analysis to changing manufacturing requirements. T-Systems implemented an open, scalable BI environment with configurable dashboards and analytical capabilities. The solution enables ASTA to perform data science and tailor analyses more independently, respond faster to deviations, and support reductions in energy and secondary-resource consumption.
Read the ASTA Brazil success story
Mercedes-Benz faced growing volumes of test-drive data from increasingly complex vehicle electronics, sensors, and bus systems. T-Systems developed an end-to-end Data-as-a-Service approach combining central cloud and decentralized edge resources. Big Data Signal Processing can make decoding and subsequent analysis up to 40 times faster than conventional tools and reduce the data volume by up to 90 percent.
Read the Mercedes-Benz success story
Knorr-Bremse and T-Systems demonstrate how a data-space approach can support efficient exchange and improved access to relevant information across participants. The LivingLab environment provides a practical setting for data sharing and analysis while applying defined controls over exchanged information.
Read the Knorr-Bremse success story
ENERGIEALLIANZ Austria worked with T-Systems on an AI-powered client radar that integrates relevant sources and presents current customer information for account managers. Built in the customer's Azure environment using OpenAI on Azure, the solution reduced sales-research time by 50 percent and provides a foundation for further AI use cases.
Read the ENERGIEALLIANZ Austria success story
Data science is the process of using data, analytical methods, statistics, programming, and business knowledge to answer questions, identify patterns, predict outcomes, and support decisions.
Data analytics focuses on examining data to answer questions and produce insights. Data science includes analytics but can additionally involve statistical inference, experimentation, machine learning, optimization, and development of analytical products. Data analysis is a narrower activity within analytics.
Machine learning is a set of methods for training models to learn patterns from data. Data science is broader and includes data preparation, statistics, exploration, experimentation, visualization, and business interpretation.
Data science provides many of the data preparation, analytical modeling, and evaluation practices used in AI systems. AI is broader and can include methods beyond data science and machine learning.
A typical project includes problem definition, data assessment and preparation, exploration, method selection, modeling, validation, communication or deployment, and ongoing monitoring.
The required data depends on the business problem. More important than volume alone are relevance, quality, coverage, consistency, lawful use, lineage, and the ability to update the data when conditions change.
Python, R, and SQL are among the most common. Python has a broad ecosystem for data processing, visualization, statistics, and machine learning.
Understanding data science concepts does not always require programming, and low-code tools can support certain tasks. Professional data science work, however, typically benefits from programming and data-query skills.
Common skills include statistics, analytical reasoning, programming, data preparation, visualization, communication, and domain understanding. Enterprise data science additionally depends on collaboration with engineering, business, security, legal, and governance specialists.
Begin with a measurable business decision, determine whether appropriate data exists, build a multidisciplinary team, and test the use case in a focused pilot before scaling.
Common challenges include inaccessible or low-quality data, unclear objectives, weak integration with business processes, skills gaps, poor governance, bias, privacy, and scaling beyond experiments.
AI changes and automates parts of data science work; it does not eliminate the discipline. Data science helps organizations prepare and assess enterprise data, evaluate retrieval and model outputs, identify systemic errors, monitor performance, govern use, and measure whether GenAI applications create real business value.
The difficulty depends on the goal and starting point. Business users need to understand data, uncertainty, and decision impact; analysts should add SQL, visualization, and basic statistics; professional data scientists need stronger skills in statistics, programming, modeling, and validation. Beginners should start with Python or SQL, a small real-world dataset, and a clear question before moving to machine learning or MLOps.
1 Principles of the GDPR, European Commission (https://commission.europa.eu/law/law-topic/data-protection/information-business-and-organisations/principles-gdpr_en)
2 Artificial Intelligence Risk Management Framework (AI RMF 1.0), 2023, National Institute of Standards and Technology (https://nvlpubs.nist.gov/nistpubs/ai/nist.ai.100-1.pdf)
3 Regulation (EU) 2024/1689 (Artificial Intelligence Act), 2024, European Union (https://eur-lex.europa.eu/legal-content/EN/TXT/?uri=celex%3A32024R1689)